The primary objective is to utilize Amazon Web Services (AWS) to optimize and automate the COVID-19 data analysis process. By analyzing key parameters like confirmed cases, deaths, vaccinations, and more, across different countries, we aim to gain valuable insights and take necessary actions to combat the virus’s spread effectively.
Challenges
Data Quality and Reliability
Scalability and Performance
Complex Data Transformations
Integration and Compatibility
Benefits
Timely and Automated Data Extraction
Comprehensive Data Analysis
Interactive Data Visualization
Scalability and Flexibility
METHODOLOGY
Data Extraction
Raw COVID-19 data is extracted from the trusted source of Our World in Data (OWID) which actively provides COVID-19 information on a daily basis. The process is automated and stored in a designated location for further analysis.
Data Transformation
The extracted data is sent for transformation into a format that can be used for analysis and visualization. This may involve cleaning the data, removing duplicate records, and correcting any errors. It may also involve transforming the data into a different data format, such as a star schema or a snowflake schema.
Data Loading
The transformed data is loaded into a data catalog or database for better organization and management. Metadata tables are created to provide a comprehensive view of the data’s structure and characteristics. The data is loaded into a high-performance database cluster for efficient querying and analysis.
Data Visualization
The loaded data is connected to a visualization or a BI tool where data is visualized in an interactive and meaningful manner to the user.
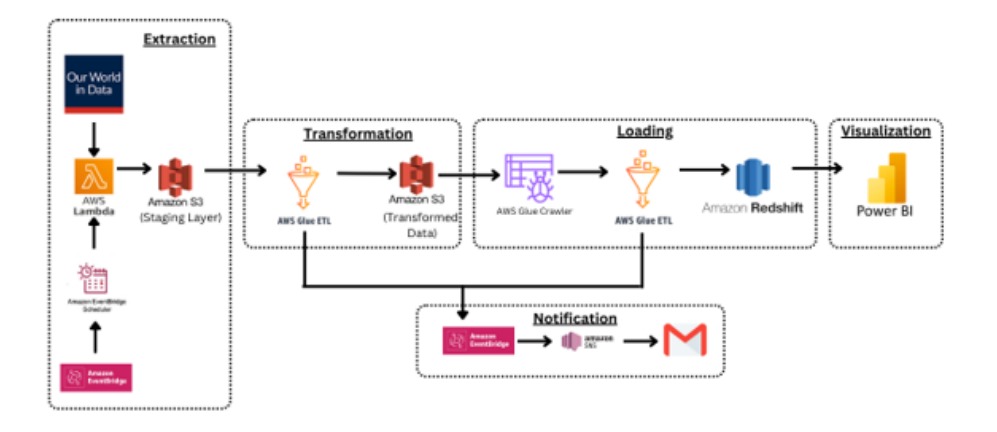
Project Architecture
Our Approach
The raw COVID-19 dataset is automatically extracted from the website daily using AWS Lambda which is automated by Amazon Event Bridge. The extracted data is then staged in an S3 bucket.
The extracted data is then sent to Jupyter Notebook in AWS Glue Job is used to transform the data by following the steps below using PySpark:
Create 5-dimension tables and a fact table.
Handle null/missing values and remove duplicate records from the dimension and fact tables.
Upload these tables as .csv files into an S3 bucket.
Glue Crawlers are then used to discover and populate the AWS Glue Data Catalog with metadata tables. Then, data from the Glue database is loaded into an AWS Redshift cluster.
Visualize: The data is then visualized through a Power BI dashboard, which allows for the generation of multiple reports for the purpose of gathering insights.
Solution
This task provides an efficient solution for extracting and analyzing the COVID-19 dataset, leading to valuable insights. By automating data extraction, transforming it into structured tables, and loading it into a centralized database, we enable comprehensive analysis of key parameters.
The visualization component facilitates the generation of informative reports. This project helps individuals by providing timely and accurate information on COVID-19 trends, enabling informed decision-making, and supporting proactive measures to protect their health and well-being.
It empowers individuals with a deeper understanding of the pandemic’s impact, facilitating personal risk assessment and the adoption of appropriate preventive measures.