Designing a Streaming Data Pipeline with DataFlow and Visualization Dashboard Using Looker
Problem Statement
Due to challenges with batch data processing, the organization is having trouble collecting real-time insights. The company consequently plans to build a streaming data pipeline in order to analyze real-time data from its e-commerce website. The streaming data pipeline would ingest, process, and store the data so that it could be utilized to study customer behavior and improve the user experience.
System Design Consideration
Cloud Dataflow
Cloud Dataflow is a fully managed, cloud-based service provided by Google Cloud Platform (GCP) for building and running large-scale data processing pipelines. It is a serverless data processing service that allows users to build batch and streaming data processing pipelines using the Apache Beam programming model.
Cloud PUB/SUB
It provides reliable, real-time messaging that enables asynchronous communication between distributed systems and applications. Cloud Pub/Sub supports both pub-sub and streaming messaging patterns and can handle millions of messages per second.
BigQuery
BigQuery is a fully-managed, cloud-based data warehousing and analytics platform in GCP. It enables users to analyze massive datasets using SQL queries and provides scalable, high-performance data processing capabilities
Looker
Looker is a business intelligence and data analytics platform that allows users to visualize and analyze their data using a web-based interface. it allows them to develop, manage, and share their data models and analytics.
Solution
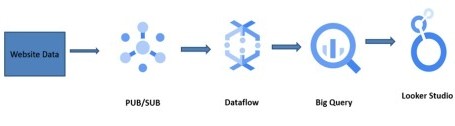
Creating a streaming data pipeline for a real-time dashboard with Dataflow involves creating a data processing pipeline using Dataflow, applying data transformation logic to the incoming data streams, and monitoring the solution to ensure it is operating effectively and efficiently.
The solution provides businesses with real-time insights, enabling them to make informed decisions With Dataflow’s autoscaling and fault-tolerant capabilities, businesses can handle increasing volumes of data as they grow. Additionally, the solution is cost-effective, as businesses pay for the resources they use.